Capability
Dashboard
A live, side-panel dashboard that tells you exactly where the current sprint stands — pass rate, blocked tests, module hot spots, and what changed in the last hour.
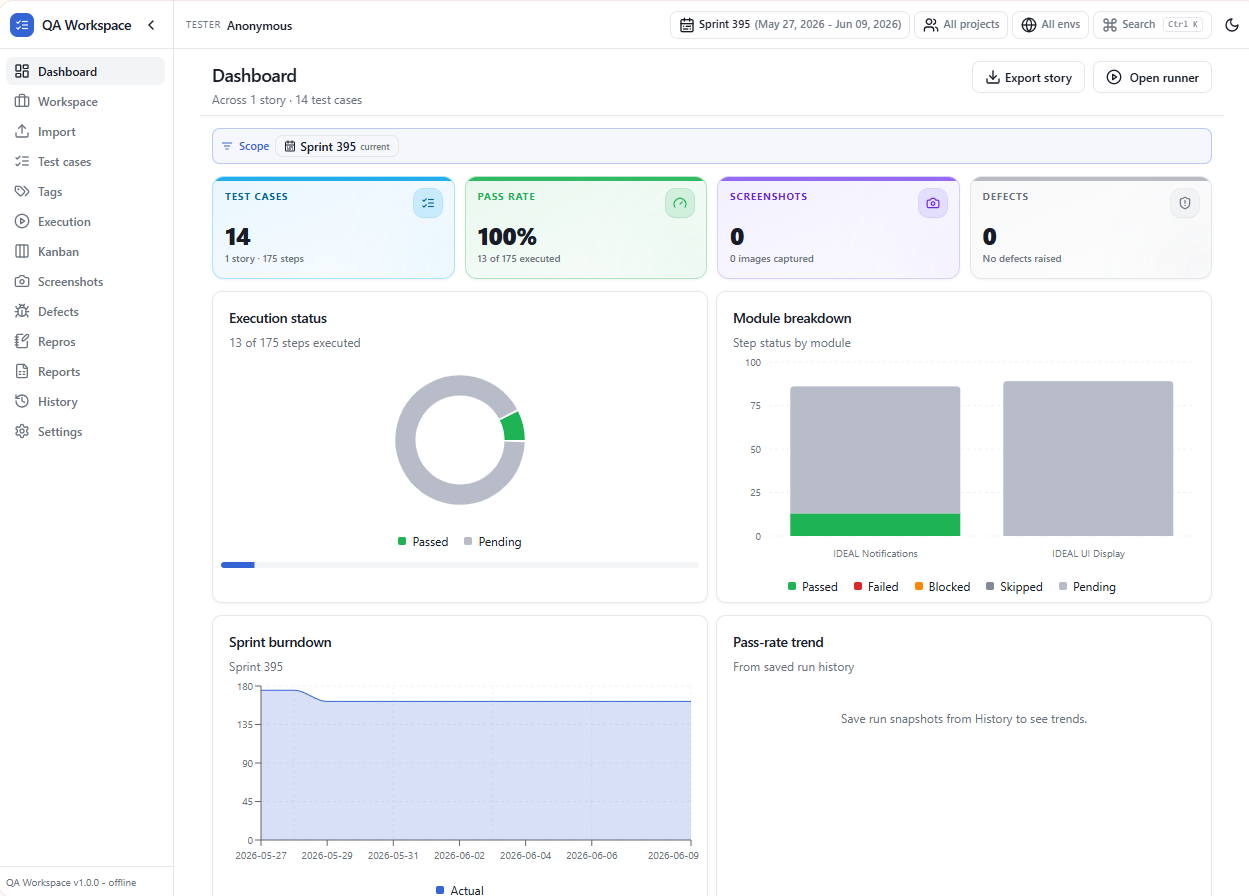
How to use it
- 1 Open the side panel and click Dashboard in the left rail.
- 2 Pick the story or suite from the picker at the top. The dashboard re-aggregates instantly.
- 3 Use the sprint filter to scope tiles to a specific sprint number (auto-detected from your suites).
- 4 Click any tile to jump straight to the underlying test cases, defects, or run history.
Use cases
Sprint stand-up
Open the dashboard in the side panel during stand-up and read pass rate, blocked count, and open defects without switching tools.
Module hot spots
The module breakdown highlights which area carries the most failures so you can re-prioritize before the next regression cycle.
Sprint burndown
See how many test cases remain pending across the current sprint and project a completion date based on yesterday's velocity.
Activity audit
The recent activity feed records every status change, screenshot, and defect — useful for evidence and handover.
Tips
- The dashboard is read-only — safe to share screen during demos and reviews.
- Pin the dashboard tab in the side panel so it survives Chrome restarts.
- Tiles update in real time as you mark steps in the runner — no refresh needed.